
Introduction
In this article, I will show how to display and customize a graph in a browser with the help of SigmaJS, a JS library dedicated to graph drawing delivered under the MIT licence.
Installation
How-to
There are four steps to follow :
Step 1 : Install sigmajs binaries
sigmajs can be found on :
Step 2 : Import the JavaScript library in your web page
The minimal script you have to load is : <script src="./build/sigma.min.js"></script>.
Personally, I prefer to import all the source files, it helps to lighten the library by removing the unused source files (ex: I don’t need SVG & Webgl renderers if I use canvas).
Step 3 : Create an HTML container
You have to create an HTML element, for example a div with an id like this : <div id='sigma-container'></div>.
Moreover, you also need to give it an height and width, otherwise it will have a size of 0 pixel.
This is easily done with some CSS : #sigma-container { width:100%, height:100%}
Step 4: Initialize sigmajs
To initialize Sigmajs, you need to call the function sigma with those arguments :
-
A render : it contains the HTML element that sigmajs will use to display the graph, plus the type of renderer (SVG, canvas or WebGL)
-
sigmajs’s settings : this object will override the default settings, so you can pass an empty object for now. The complete settings list is available here
At the end, you should have something like that :
<html>
  <head>
    <title>SigmaJS example</title>
    <script src="./build/sigma.min.js"></script>
    <style>
      html { height:100%;}
      body {height: 100%;}
      #sigma-container { width:100%; height:100%; background-color:#E1E1E1}
    </style>
  </head>
  <body>
    <div id='sigma-container'></div>
    <script>
      // Initialize sigma:
      var s = new sigma(
        {
           renderer: {
             container: document.getElementById('sigma-container'),
             type: 'canvas'
           },
           settings: {}
         }
       );
    </script>
  </body>
</html>
How to choose between SVG, Canvas and Webgl ?
SigmaJS can used one this technology to display your graph : svg, canvas & webgl.
SVG is a markup language, directly interpreted by your browser, so it’s easy to customize nodes & edges style, you just have to add some CSS rules. But when you apply a layout algorithm on the graph, you continuously change the DOM of the SVG, and if this DOM is heavy, the result is slow and can freeze your browser.
Canvas is an HTML5 element compatible with all modern browsers. It defines an area on your web page where you can draw some pixels by using a JavaScript API. The JavaScript code is directly interpreted by your browser and it decides what and when to render. Due to this, Canvas scales more than the SVG, but if you want to change the color of a shape, you need a way to specify it in the code.
On the other hand, there is WebGL, compatible with almost all newest browsers (even if the API is not stable). As in Canvas, you need to write some JavaScript code for rendering your visualisation, but this time, its computation is delegated to OpenGL so to your GPU.
To resume :
| SVG | Canvas | WebGL | |
|---|---|---|---|
Browser compatibility |
ALL (even old ones) |
ALL |
Modern browsers |
Render phases |
SVG creation > Browser parsing > Browser rendering |
JS code > Browser rendering |
JS Code > OpenGL rendering |
Performance |
Slow |
Normal |
Performant |
The choice will depend on your needs, and also of the SigmaJS plugins you want to use (plugins are not compatible with every format).
I suggest you to choose Canvas or Webgl if you want to really display a big graph.
The SigmaJS graph structure
Definition
Now that sigma is initialized, we need to give it a graph. It structure is simple : an object with an array of nodes and an array of edges.
| Field | Type | Required | Description |
|---|---|---|---|
|
Any |
Yes |
Node identifier, must be unique across all the node |
|
String |
No |
|
|
Float |
Yes |
Position of the node in 2D. Can be initialize with |
|
Float |
No (0) |
Size of the node that is use to render it. |
|
Color RGB |
No ( |
Color used to display the node. |
| Field | Type | Required | Description |
|---|---|---|---|
|
Any |
Yes |
Edge identifier, must be unique across all the edge. |
|
Any |
Yes |
Starting node’s identifier of the edge. |
|
Any |
Yes |
Ending node’s identifier of the edge. |
|
|
No (line) |
Edge type for its render. |
|
Float |
No ( |
Size of the edge that is use to render it. |
|
Color RGB |
No ( |
Color used to display the edge. |
Example
var graph = {
  nodes: [
    { id: "n0", label: "A node", x: 0, y: 0, size: 3, color: '#008cc2' },
    { id: "n1", label: "Another node", x: 3, y: 1, size: 2, color: '#008cc2' },
    { id: "n2", label: "And a last one", x: 1, y: 3, size: 1, color: '#E57821' }
  ],
  edges: [
    { id: "e0", source: "n0", target: "n1", color: '#282c34', type:'line', size:0.5 },
    { id: "e1", source: "n1", target: "n2", color: '#282c34', type:'curve', size:1},
    { id: "e2", source: "n2", target: "n0", color: '#FF0000', type:'line', size:2}
  ]
}
Loading graph in sigma
Sigma has a complete API to manage its graph data. I let you see the API documentation.
To load a graph in sigma, you just have to call the method read on the sigma graph instance : s.graph.read(graph)
Once it’s done, we need to tell sigma to draw the graph by calling its refresh function : s.refresh()
Live example
Graph layout algorithm
Definition
What is hard in displaying a graph is to rapidly display it in such a way that we can see all nodes and their edges without overlaps (in fact less as possible). To do it, we need an algorithm that computes the position of each nodes, and the most known for that are the force-directed algorithms.
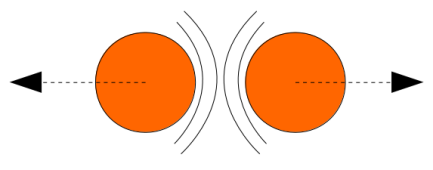
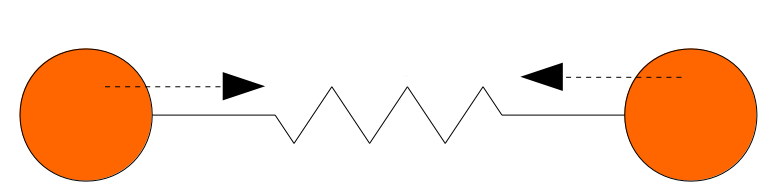
The principle is simple, you need to consider two forces :
| Repulsive | Attractive |
|---|---|
Nodes repulse each others. You can consider nodes like particle with the same electric charge. |
Two nodes with an edge, attract themselves. You can consider an edge as a spring |
|
|
Then you run an algorithm that compute on each iteration, the sum of the applied forces on each node, and move them in consequence. After a number of iteration, you will see that graph is in a stable state.
Force-Atlas2
SigmaJS include (as a plugin) a forced-directed algorithm called Force-Atlas2.
To use it, you need to :
-
Step 1 : import the plugin files
<script src="./build/plugins/sigma.layout.forceAtlas2/supervisor.js"></script>
<script src="./build/plugins/sigma.layout.forceAtlas2/worker.js"></script>-
Step 2 : Run it
Now that the plugin is loaded, we can directly call it on the sigma instance : s.startForceAtlas2();
This creates a web worker where all the algorithm iterations will be calculated.
-
Step 3 (al) : Stop it
The algorithm won’t stop by itself, so I recommend you to stop it after a predefined duration (10 seconds in my example) : window.setTimeout(function() {s.killForceAtlas2()}, 10000);
Live example
Plugins
SigmaJS has a lot of plugins, you can see the list here. I will not show you all of them, so I have done a list of my most used plugins.
Edge labels
This plugin allows you to add a label on each edge. I mainly use it to display the Neo4j’s relationship type.
To use it :
-
Import the needed script (in my case
settings.js,sigma.canvas.edges.labels.def.js&sigma.canvas.edges.labels.curvedArrow.js) -
Add a
labelproperty on yours edges
Edge parallelEdges
If you want parallel edges (ie. to have multiple relationship between two nodes), it’s the plugin you must have.
To use it :
-
Import the needed script :
-
utils.js -
sigma.canvas.edges.curvedArrow.js&sigma.canvas.edgehovers.curvedArrow.jsif you have a directed graph. -
sigma.canvas.edgehovers.curve.js&sigma.canvas.edges.curve.jsif you want the an undirected graph. -
sigma.canvas.edges.labels.curve.jsif you have enabled label on edges
-
-
Add a property
countthat represent the index of the edge in the set of parallel edges. Inversely proportional to the amplitude of the vertex of the edge curve.
Relative size
This plugin is really useful when you want to see which node is most connected. The size of the node depends of its degree, ie. its number of in-going & outgoing edges.
Sigma and Neo4j
Now that you know how to use Sigma, the next step is to build a graph visualisation from Neo4j.
To do this there is two points :
-
How to query Neo4j in your browser ?
-
From a query result, how to build a sigma graph structure
I will not explain the first point, Michael has already done this part in this excellent post.
So let see the second one !
Create a graph structure from a Neo4j query
Result of a query is a collection of tuple, ie. composed of rows where each row has some columns.
Moreover, each cell is typed, and to display a graph we only want node, relationship and path.
To create our data structure, we need to iterate over rows, then over columns and finnaly check the type. If it’s a node or relationship, we can add it to our sigma graph structure (if it’s not already present).
And what about path ? A path in Neo4j driver types, is an array of segment where each segmet is composed of :
-
a starting node
-
a relationship
-
an ending node
So if we have a path, we need also to iterate over it to add starting & ending node, plus the relationship.
But wait, a Neo4j node (resp. relationship) is not a Sigma node (resp. relationship), so we also need to convert them.
If you code it, finally you should have something like this :
let graph = { nodes:[], edges:[]} ;
this.driver.session().run("MATCH (n)-[r]->(m) RETURN n,r,m LIMIT $limit", {limit:50}).then(
  (result) => {
    // for each rows
    result.records.forEach( record => {
      // for each column
      record.forEach( ( value, key ) => {
        // if it's a node
        if ( value && value.hasOwnProperty( 'labels' ) ) {
          graph.nodes.push(convertionToSigmaNode(value));
        }
        // if it's an edge
        if ( value && value.hasOwnProperty( 'type' ) ) {
          graph.edges.push(convertionToSigmaEdge(value));
        }
        // if it's a path
        if ( value && value.hasOwnProperty( 'segments' ) ) {
          value.segments.forEach( ( seg ) => {
            // add starting & ending nodes + relationship
            graph.nodes.push(convertionToSigmaNode(seg.start));
            graph.nodes.push(convertionToSigmaNode(seg.end));
            graph.edges.push(convertionToSigmaEdge(seg.rel));
          });
        }
      });
    })
  })
And here we go, you have everything to display your graph from a Cypher query with SigmaJS !
It’s a little borring, no ? All this code just to display a graph… And what if I tell you that I have already made the work for you ?
Neo4j + Sigma = NeoSig
To avoid you the complexity of doing all the above work, I have created a library for that : NeoSig.
To use it, you need to import the library + the Neo4j driver :
<script src="https://cdn.jsdelivr.net/npm/neo4j-driver@1.6.0"></script>
<script src="https://cdn.jsdelivr.net/npm/neosig@1.2.2/docs/neosig-1.2.2.js"></script>|
Note
|
The library embed SigmaJS (with some customs code) but not the Neo4j driver. |
Then you can call the function Neo4jGraph(neo4jConfig, neo4jStyle, query, queryParams), it returns a promise with the sigma graph object.
Neo4jGraph(neo4jConfig, neo4jStyle, 'MATCH (n)-[r]->(m) RETURN n,r,m LIMIT $limit', {limit:20}).then( function(graph) {
  s.graph.read(graph);
  // enable drag'n'drop
  sigma.plugins.dragNodes(s, s.renderers[0]);
  // start layout
  s.startForceAtlas2();
  setTimeout(() => { s.stopForceAtlas2() }, Math.log(graph.nodes.length*graph.edges.length)*1000);
});
Where neo4jConfig is an object with :
const neoConfig = {
  url:'bolt://localhost:7867',
  user: 'neo4j',
  password: 'letmein',
  driver : {
    // all the driver configuration (optional)
  }
}
And neo4jStyle is :
const neoStyle = {
  labels: { // Map of label
    Person : {
      label: 'name', // The node's property to display as label
      color: '#654321', // Color of the node
      size: 10, // Size of the node
      icon: { // icon object
        name: 'f007', // Fontawesome unicode
        color: '#FFF', // Color of the font
        scale: 1.0 // Scale ratio
      }
    },
    Movie : {
      label: 'title',
      color: '#123456',
      size: 10,
      icon: {
        name: 'f008',
        color: '#FFF',
        scale: 1.0
      }
    }
  },
  edges: { // Map of edges
    ACTED_IN: { // Name of the relationship type
      label: 'roles',
      //color: '#202020',
      // size: 2
    }
  }
};|
Note
|
By default, a node is black, with a size of 5, and the label is its Neo4j’ID ; a relationship is black with a size of 1, and the label is its Neo4j type. |
And the final result is :
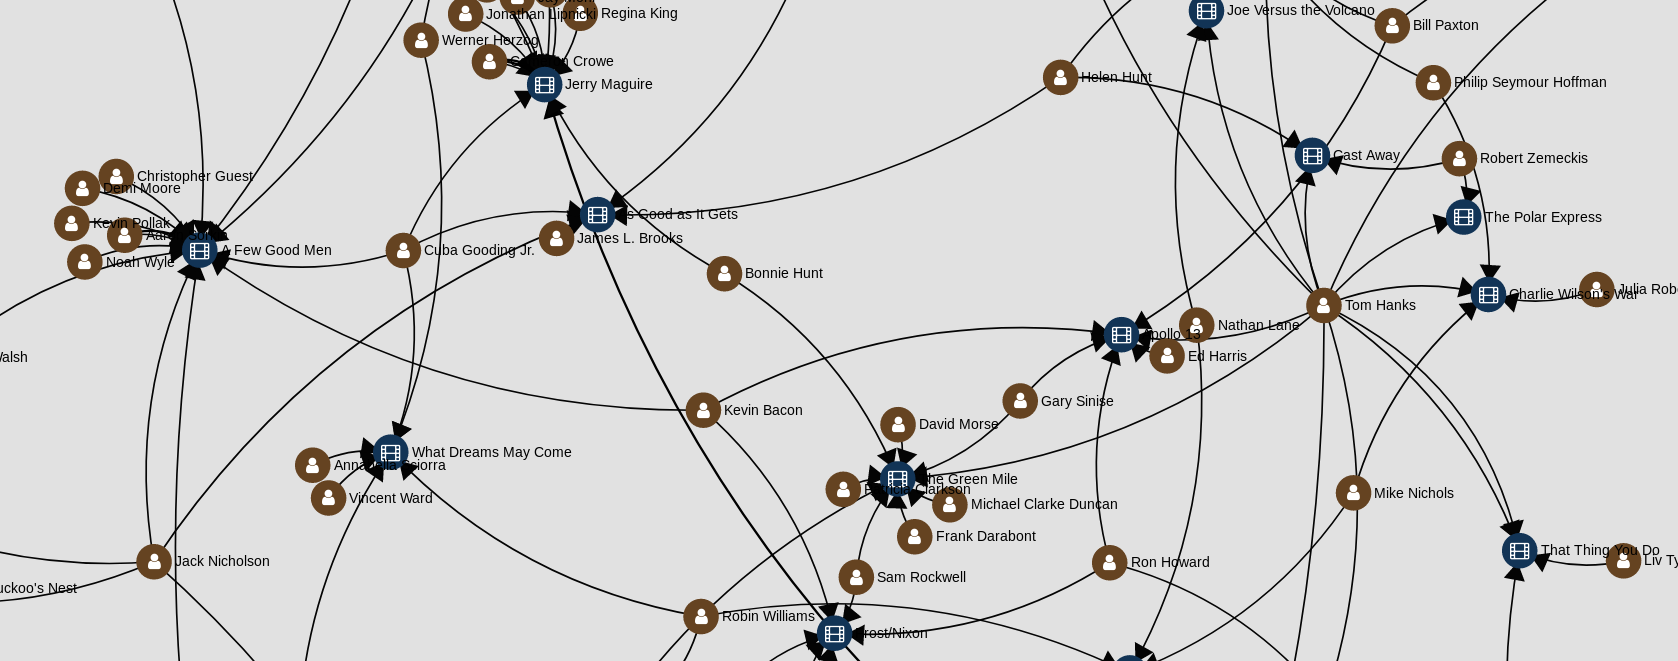
You can see the code here :
Now have fun !
A big thanks to Jacomyal, Yomguithereal and Astik for the help !