

Introduction
When you push a service in production, it’s really important to monitor its health status. This will allow you to see if everything is OK, to be alerted if something is going wrong but also in a case of a problem, to investigate.
This rule should be applied for Neo4j, and you will see how to do it with the TICK stack (from influxDB).
But before to explain how to do it for Neo4j, lets talk a little about Influxdb.
Influxdb
Concept
Influx DB is a time series database. It’s made to store and query data in times, so it’s the perfect tool to store metrics of a system.
Influx has 7 key concepts : time, field, tag, measurement, series, retention policy and continous queries.
It’s better to take an example to understand those concepts.
Imagine that you have a captor of temperature and humidity in your living room and an other one in your bedroom. Each time you will read one, you will receive the data at a point of time.
Because it’s the same kind of data, you will store them at the same location. But you also want to be able to distinguish the data from the living room and the bedroom.
At the end, you will have something like that :
name: captor_temperature_humidity
----------------------------------
time                    temperature   humidity   room
2015-08-18T00:00:00Z    18.3          51.2       Living Room
2015-08-18T00:00:00Z    16.7          48.9       Bedroom
2015-08-18T00:01:00Z    18.5          51.1       Living Room
2015-08-18T00:01:02Z    16.9          49.0       Bedroom
...
Here we have a measurement name called captor_temperature_humidity (you can think about it like a table in SQL) and each line is measurement.
Measurement is composed of : time , temperature, humidity and room
Temperature and humidity are measurement’s fields, and their values are the data you want to follow in time.
On each measurement, I have added the room to know where comes the measurement. It’s a measurement’s tag (a metadata), and you can have multiple tags for a measurement.
By the time, you will have a very huge number of measurement, and usually you don’t want to save them forover. It’s where the concept of retention policy takes place, you can configure the database to delete measurements older than X (X is hours, days, weeks, …, years).
CREATE RETENTION POLICY one_week ON my_database DURATION 1w;|
Note
|
The default retention policy is to keep the data forever. |
Moreover, you can define some continious queries to aggregate measurements over time. it will create a new (aggregated) measurement on the same database but with a new retention policy :
CREATE CONTINUOUS QUERY "my_continious_query" ON "my_database"
BEGIN
  SELECT mean("temperature") INTO "my_database"."one_week"."average_temperature" FROM "captor_temperature_humidity" GROUP BY time(1h)
END
So with the help of retention policies and continious queries, you can downsampling the data with somehting similar as that :
-
keep the fine data for 1 week
-
aggregate per minute for data between one week and one month
-
aggregate per 10 minutes for data older than a month
This give those retention policies :
CREATE RETENTION POLICY "1_week" ON "my_database" DURATION 7d REPLICATION 1 DEFAULT
CREATE RETENTION POLICY "1_month" ON "my_database" DURATION 30d REPLICATION 1
CREATE RETENTION POLICY "forever" ON "my_database" DURATION INF REPLICATION 1
And those continuous query :
CREATE CONTINUOUS QUERY "cq_1min_1month" ON "my_database"
BEGIN
  SELECT mean(*) INTO "my_database"."1_month".:MEASUREMENT FROM /.*/ GROUP BY time(60s),*
END;
CREATE CONTINUOUS QUERY "cq_1min_1month" ON "my_database"
BEGIN
  SELECT mean(*) INTO "my_database"."forever".:MEASUREMENT FROM /.*/ GROUP BY time(600s),*
END;
The TICK stack
TICK stack is composed of :
-
Telegraf : an agent that collects metrics, and write them in an influx database.
-
Influx : the time series database
-
Chronograf : a front-end applicatino that allow you to explore your data and to create dashboards.
-
Kapacitor : an alerting system
It’s a complete stack to collect, manage and exploit your time series data, so it’s perfect for my goal.
The architecture
Generally there is a server where all the metrics are a centralized, and where all the monitoring application are installed. I will call it the Monitoring server.
This server will save all the metrics fron your system, and to do it there is two methods :
-
push : metrics are directly pushed to the monitoring server by using an agent on each server that you want to monitor.
-
pull : the monitoring system will query all your servers to collect the metrics.
Generally, the first solution is prefered, and it’s the one that I will put in place.
This is the architecture schema :
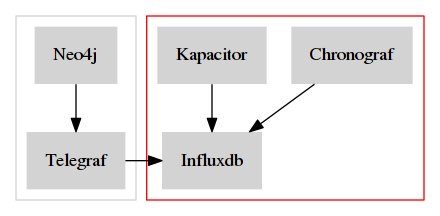
In red you have the monitoring server, and in grey the monitored server.
|
Note
|
With this kind of architecture, Neo4j send metrics locally, so it’s very fast. |
The monitored server
Neo4j
In its Enterprise Edition, Neo4j has a monitoring system. In fact there is four ways to monitor it :
-
JMX : it’s a standard java functionnality that allow you to retrive some metrics values.
-
Graphite connector : you just have to configure your Graphana server, and Neo4j will send its metrics regulary.
-
Prometheus connector : same as for Graphite but for Prometheus time series database.
-
CSV file : Neo4j dumps all its metrics at a regular time interval
Telegraf is compatible with the Graphite protocol, so I will use it.
The configuration is really simple, just edit your neo4j.conf file and put at the end those lines :
# Setting for enabling all supported metrics.
metrics.enabled=true
# Setting for enabling all Neo4j specific metrics.
metrics.neo4j.enabled=true
# Setting for exposing metrics about transactions; number of transactions started, committed, etc.
metrics.neo4j.tx.enabled=true
# Setting for exposing metrics about the Neo4j page cache; page faults, evictions, flushes and exceptions, etc.
metrics.neo4j.pagecache.enabled=true
# Setting for exposing metrics about approximately entities are in the database; nodes, relationships, properties, etc.
metrics.neo4j.counts.enabled=true
# Setting for exposing metrics about the network usage of the HA cluster component.
metrics.neo4j.network.enabled=true
# Enable the Graphite integration. Default is 'false'.
metrics.graphite.enabled=true
# The IP and port of the Graphite server on the format <hostname or IP address>:<port number>.
# The default port number for Graphite is 2003.
metrics.graphite.server=localhost:2003
# How often to send data. Default is 3 seconds.
metrics.graphite.interval=3s
# Prefix for Neo4j metrics on Graphite server.
metrics.prefix=MyHost
Like you see, I just :
-
enable the metrics feature and also each familly metric.
-
enable the graphite integration, and configure its location, time interval and the prefix.
You don’t have to change anything, except the metrics.prefix. This value will be used as the host identifier in metrics.
Telegraf
Installation
There are many ways to install Telegraf on your system, and you can check directly on the documentation.
My prefer OS is debian, so I will show you how to do on it :
-
add the influxdb repository key
-
add the repository
-
perfom an update
-
install the package
telegraf
curl -sL https://repos.influxdata.com/influxdb.key | apt-key add -
echo "deb https://repos.influxdata.com/debian jessie stable" | tee -a /etc/apt/sources.list
sudo apt-get update
sudo apt-get install telegraf
Configuration
All Telegraf's configuration is located in the file /etc/telegraf/telegraf.conf.
Firstly we need tell Telegraf to be able to act as a graphite server :
[[inputs.socket_listener]]
  service_address = "tcp://:2003"
  separator = "."
  data_format = "graphite"
  templates = [
    "*.neo4j.*.* host.measurement.measurement.field* name=neo4j,vlan=testing",
    "*.vm.*.* host.measurement.measurement.field* name=neo4j,vlan=testing"
  ]
I think it’s easy to understand, except for the templates part.
In fact, in graphite all metrics follow a schema like this one MyHost.neo4j.bolt.messages_done 10.
So we need to tell Telegraf how to parse it to find the field measurement, the value, and tags.
The part *.neo4j.*.* is a filter. If a line match this pattern, then it will parsed with host.measurement.measurement.field*.
With the example MyHost.neo4j.bolt.messages_done 10, we will have :
-
Tags:
MyHost -
Measurement:
neo4j.bolt -
Field:
messages_done -
value:
10
Moreover, at the end of each template you can see this name=neo4j,vlan=testing.
It’s a list of static tags that will be added to each metric.
This can be really useful if you want to monitor multiple Neo4j server (like a cluster).
Ok, now we have the metrics, but we need to push them to our centralized influx database. For this, you need to configure Telegraf like this :
[[outputs.influxdb]]
  ## The full HTTP or UDP URL for your InfluxDB instance.
  urls = ["http://10.0.0.12:8086"]

  ## The target database for metrics; will be created as needed.
  database = "telegraf"

  ## Name of existing retention policy to write to.  Empty string writes to
  ## the default retention policy.
  retention_policy = ""
You just have to change the urls property with yours (in my case http://10.0.0.12:8086), and optionnally the database name (by default it’s telegraf) and the rentention policy you want.
|
Note
|
In the general section of the configuration, you can configure the batch size if you want. |
The monitoring server
Installation
On this server we will install : InfluxDb, Chronograf, Kapacitor and Telegraf (to monitor the monitoring system ^^)
I will follow the same process as explained on the installation of Telegraf : via apt.
curl -sL https://repos.influxdata.com/influxdb.key | apt-key add -
echo "deb https://repos.influxdata.com/debian jessie stable" | tee -a /etc/apt/sources.list
sudo apt-get update
sudo apt-get install telegraf influxdb chronograf kapacitor
InfluxDb
I change nothing in the default configuration of Influxdb,
The only thing I will do it’s to create a database telegraf with a custom retention policy that keep the data for 3 months.
For this I will use the Influxdb CLI, sudo influx, and typing those commands :
CREATE DATABASE telegraf
USE telegraf
CREATE RETENTION POLICY "3_month" ON "monitoring" DURATION 90d REPLICATION 1|
Note
|
If you want to check, you can type SHOW RETENTION POLICIES to display all RPs.
|
Telegraf
I have installed Telegraf just to monitor the monitoring server (CPU, network, disk, …).
You just have to configure it to send all the data to the telegraf (the default value).
[[outputs.influxdb]]
  ## The full HTTP or UDP URL for your InfluxDB instance.
  # default is localhost with the standard port of influx
  # urls = ["http://10.0.0.12:8086"]

  ## The target database for metrics; will be created as needed.
  database = "telegraf"
Chronograf
By default, Chronograf is listening on the port 8888.
So open your browser at http://MONITORING_SERVER_IP:8888/ (change MONITORING_SERVER_IP with the corresponding IP).
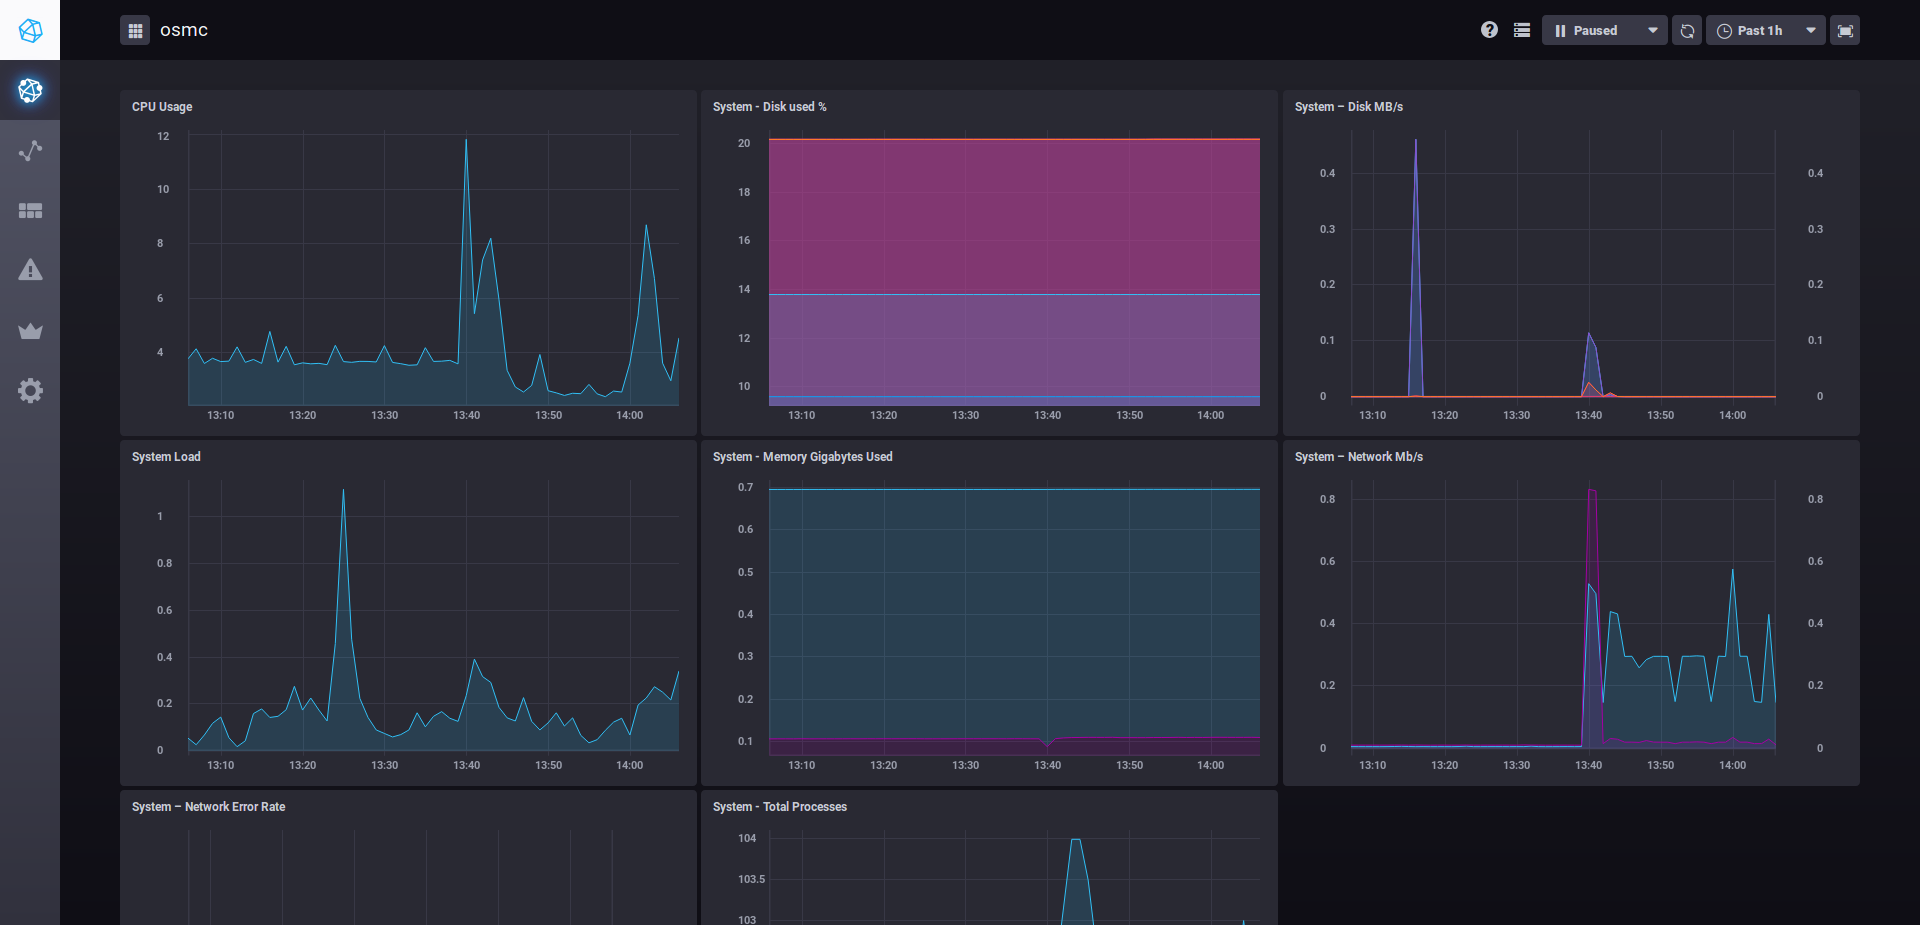
You can take a look at the Host List, you should see a list with two items : names of the monitored and monitoring server. Click on one, and should see something like this :
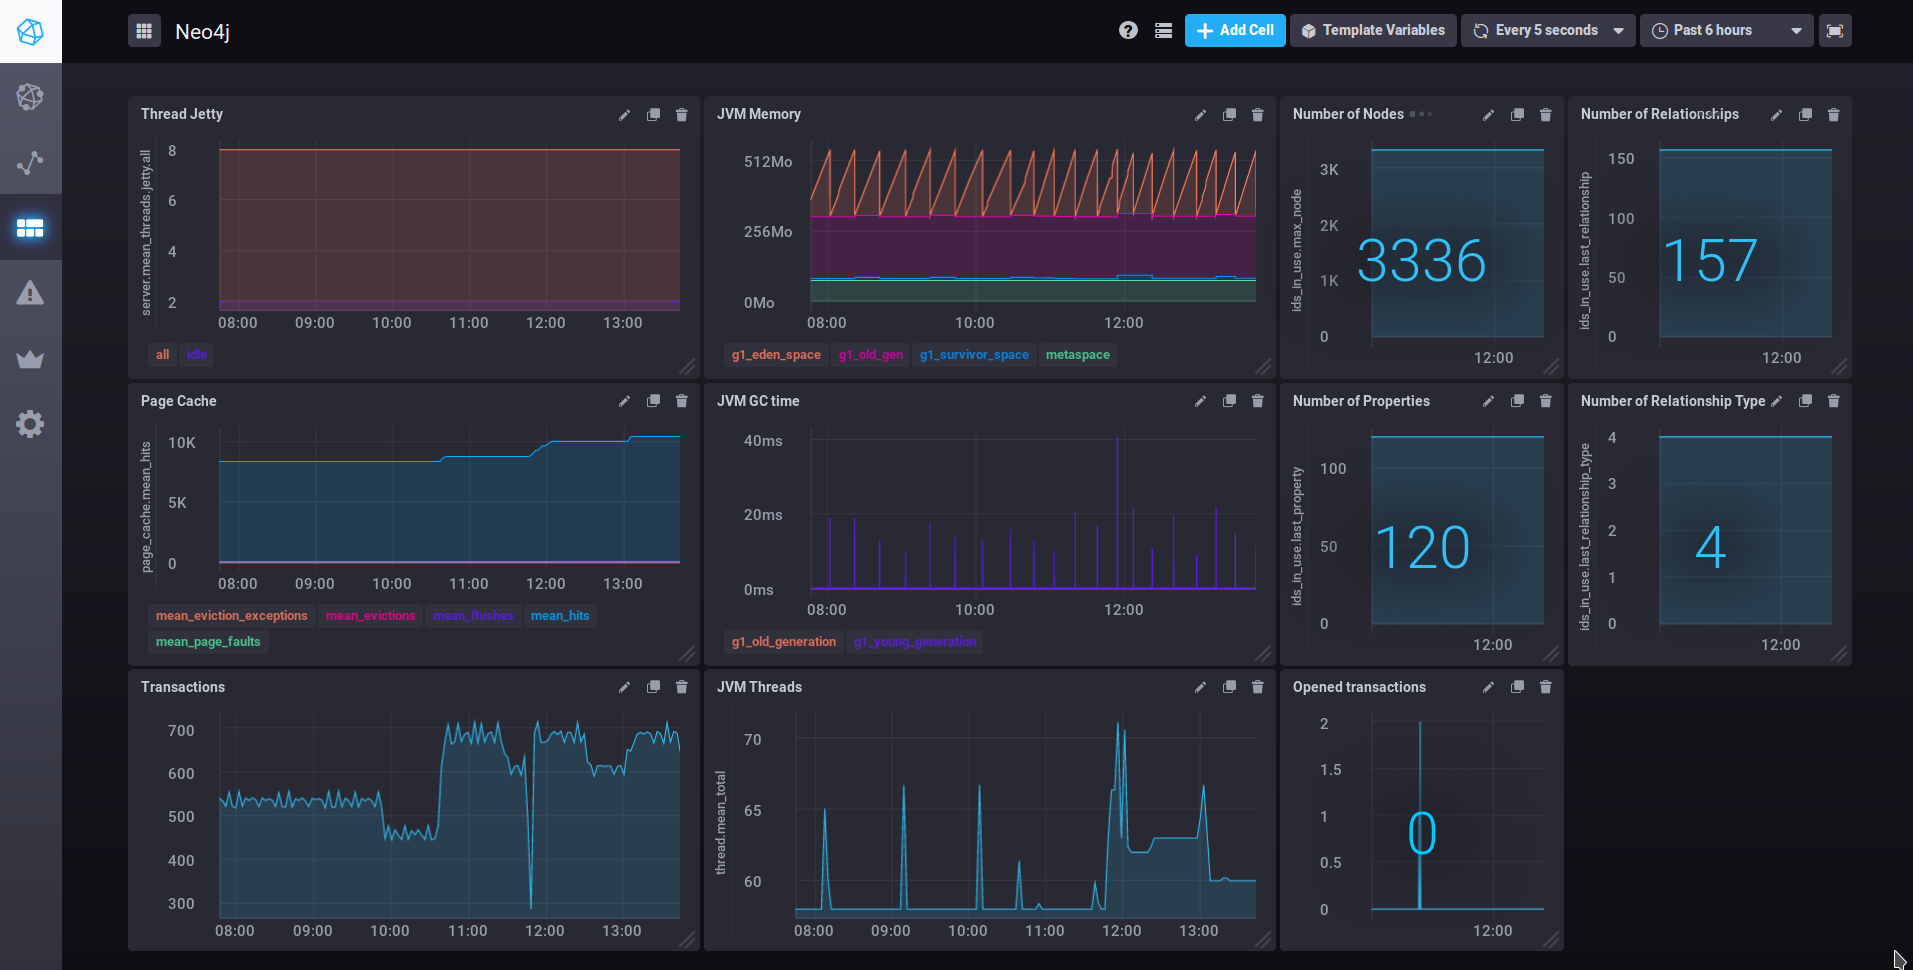
Now you can create a new dashboard for Neo4j with the following widgets :
| Name | Type | Query |
|---|---|---|
Thread Jetty |
Line Graph |
|
JVM memory |
Stacked Graph |
|
JVM GC Time |
Line Graph |
|
Transactions |
Line Graph |
|
Page cache |
Line Graph |
|
JVM Threads |
Line Graph |
|
Number of Nodes |
Line Graph + Single stat |
|
Number of relationships |
Line Graph + Single stat |
|
Number of Properties |
Line Graph + Single stat |
|
Number of Relationship Types |
Line Graph + Single stat |
|
Opened Transactions |
Line Graph + Single stat |
|
And the result :
Kapacitor
Kapacitor is the alerting systen of the stack. You can create some rules for Kapacitor directly in Chronograf :
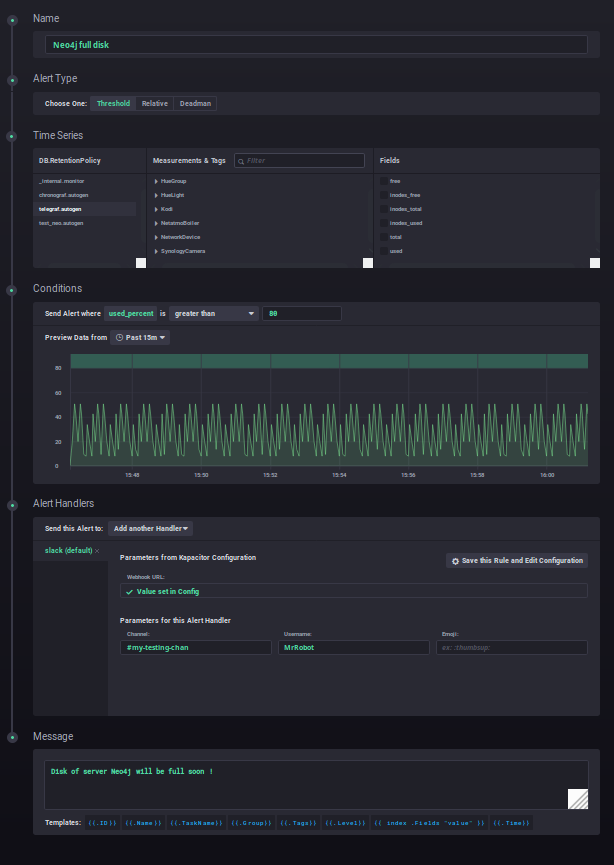
This alert sends a message on slack as soon as there less than 20% of free space on my disk :)
Conclusion
You see it’s really easy to monitor your infrastructure and Neo4j servers with the TICK stack. But there are some lacks :
-
Telegraf doesn’t have a JMX plugin
-
It’s not possible to make a generic continious query that downsample the data with the same field name (you will have an aggregation prefix). This is really annoying when you want to have only one query to make your dashboard (and not one per retention). See this link for more details
I would like to make the same kind of article but this time with Prometheus and Grafana. So if you are interested, please leave a comment, it will motivate me to write it :)